src/navier-stokes/perfs.h
Performance monitoring (for the Navier–Stokes solvers)
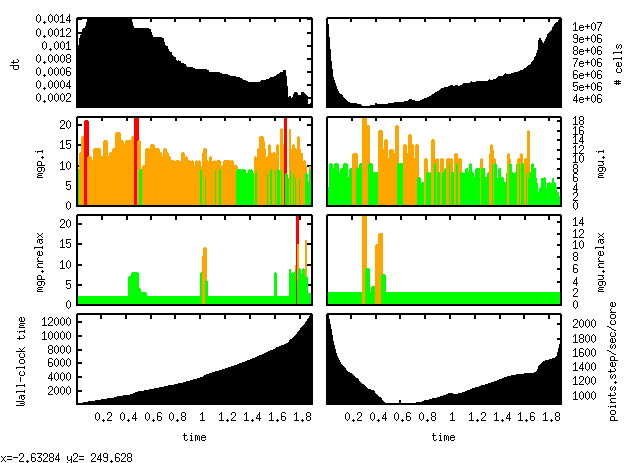
This logs simple statistics available for the various Navier–Stokes solvers.
event perfs (i += 1) {
  static FILE * fp = fopen ("perfs", "w");
  if (i == 0)
    fprintf (fp,
	     "t dt mgp.i mgp.nrelax mgpf.i mgpf.nrelax mgu.i mgu.nrelax "
	     "grid->tn perf.t perf.speed npe perf.ispeed\n");
  static double start = 0.;
  if (i > 10 && perf.t - start < 1.) return 0;
  fprintf (fp, "%g %g %d %d %d %d %d %d %ld %g %g %d %g\n",
	   t, dt, mgp.i, mgp.nrelax, mgpf.i, mgpf.nrelax, mgu.i, mgu.nrelax,
	   grid->tn, perf.t, perf.speed, npe(), perf.ispeed);
  fflush (fp);
  start = perf.t;
}
If we have a display (and gnuplot works), a graph of the statistics is displayed and updated at regular intervals (10 seconds as defined in perfs.plot).
event perf_plot (i = 10) {
  if (getenv ("DISPLAY"))
    popen ("gnuplot -e 'set term x11 noraise title perfs' "
	   "$BASILISK/navier-stokes/perfs.plot "
	   "& read dummy; kill $!", "w");
}
The graph looks like this:
Monitoring a distant run
This can also be useful to monitor what is happening to a simulation running on a remote system. The perfs.sh script provides a convenient way to do this.
Imagine you started a simulation including the perfs.h file on the “mesu” system at UPMC (typically
using the queueing system) and that the simulation is running in the
wave/level-10/ directory on mesu. You can then get a
regularly-updated graph of what is happening using:
bash $BASILISK/navier-stokes/perfs.sh mesu.dsi.upmc.fr:wave/level-10/perfsSee also
Usage
Examples
- Bubble rising in a large tank
- Transcritical flow over a bump
- Forced isotropic turbulence in a triply-periodic box
- Starting vortex of a 2D NACA2414 airfoil at Re=10000
- Stokes flow through a complex 3D porous medium
- Vortex shedding behind a sphere at Reynolds = 300
- Two-phase flow around RV Tangaroa