sandbox/jieyun/test/rti_ebit.c
Rayleigh-Taylor instability with the EBIT method
The Rayleigh-Taylor instability, RTI occurs when a heavy fluid is on top of a lighter one.
#define LEVEL 8
#define ADAPT 1

face vector av[];

#include "navier-stokes/centered.h"
#include "two-phase-ebit.h"
#include "tension.h"

const double MEANPOS = 2.00;
const double DY = 0.1;
const double lref = 1. [1];
double gra, Reynolds;
FILE *fp_amp;
This setup with 0 surface tension was adapted from Tryggvason, which has been widely investigated in several studies. The flow can be charaterized by two dimensionless numbers: Atwood number At and Reynolds number Re At = \frac{\rho_1 - \rho_2}{\rho_1 + \rho_2} = 3 Re = \frac{\rho_1 g^{1/2} d^{3/2}}{\mu_1} = 3000, d = 1
int main() {
  Reynolds = 3000. [0];
  rho1 = 3. [-3, 0, 1];
  rho2 = 1.;
  f.sigma = 0.;
  gra = 9.81 [1, -2];
  mu1 = rho1*sqrt(gra)/Reynolds*sqrt(cube(lref));
  mu2 = mu1;

  CFL = 0.05;
  DT = 2.e-4 [0, 1];
  TOLERANCE = 1e-4 [*];

  size (4. [1]);
  init_grid (1 << LEVEL);

  a = av;

  run();
  fclose (fp_amp);
}
The initial interface shape is y(x) = 2d + 0.1 d \cos(kx), \quad k = \frac{2 \pi}{d}
event init (i = 0) {
  u.t[bottom] = dirichlet(0);
  u.t[top] = dirichlet(0);

  uf.n[right] = 0.;
  uf.n[left] = 0.;

  mask (x > 1. ? right : x < 0. ? left : none);

  vertex scalar phi[];
  foreach_vertex()
    phi[] = -(MEANPOS - y + DY*cos(2. [-1]*pi*x));

  init_markers (phi);

  char name[80];
  sprintf (name, "rt_ebit_dis.dat");
  fp_amp = fopen (name, "w");
}
Output the time evolution of the hightest and lowest positions of the interface. Time is normalized by reference time \tau = t / t_{ref}.
t_{ref} = \sqrt{d / At g}
const double TREF = 0.451523641;
event amplitude (i++) {
  double ymin = 1.e10, ymax = -1.e10;
  foreach_face(y, reduction(max:ymax) reduction(min:ymin)) {
    double yc = y;
    if (with_marker.y[] > 0. && yc > ymax)
      ymax = yc;
    if (with_marker.y[] > 0. && yc < ymin)
      ymin = yc;
  }

  foreach_face(x, reduction(max:ymax) reduction(min:ymin)) {
    double yc = y - (0.5 - s.x[])*Delta;
    if (with_marker.x[] > 0. && yc > ymax)
      ymax = yc;
    if (with_marker.x[] > 0. && yc < ymin)
      ymin = yc;
  }

  fprintf (fp_amp, "%.5e %.5e %.5e\n", t/TREF, ymax - MEANPOS, ymin - MEANPOS);
  fflush (fp_amp);

  // reference file
  fprintf (stderr, "%.4e %.4e %.4e\n", t/TREF, ymax - MEANPOS, ymin - MEANPOS);
  fflush (stderr);
}
The vertical acceleration is added here.
event acceleration (i++) {
  foreach_face(y)
    av.y[] -= gra;
  boundary ((scalar *){av});
}
Ouput the interfaces at different time instants.
event interface (t = {1.*TREF, 1.5*TREF, 1.75*TREF, \
  2.*TREF, 2.25*TREF, 2.5*TREF}) {
  char name[80];

  sprintf (name, "rt_intf_ebit_%.2f.dat", t/TREF);
  output_facets_ebit (name);
}


#if ADAPT
event adapt (i++) {
  adapt_wavelet ({mask_intf, u}, (double[]){0.02, 1e-3, 1e-3},\
    maxlevel = LEVEL, minlevel = LEVEL - 3);
}
#endif
Results
Evolution of the hightest and lowest positions of the interface as a function of dimensionless time \tau
reset
set grid
set xlabel 'tau'
set ylabel 'Amplitude'
set key bottom left
plot [0.:2.5][-2.:1.] 'rt_ebit_dis.dat' u 1:2 w l lw 3 t "EBIT, upper", \
  'rt_ebit_dis.dat' u 1:3 w l lw 3 t "EBIT, lower"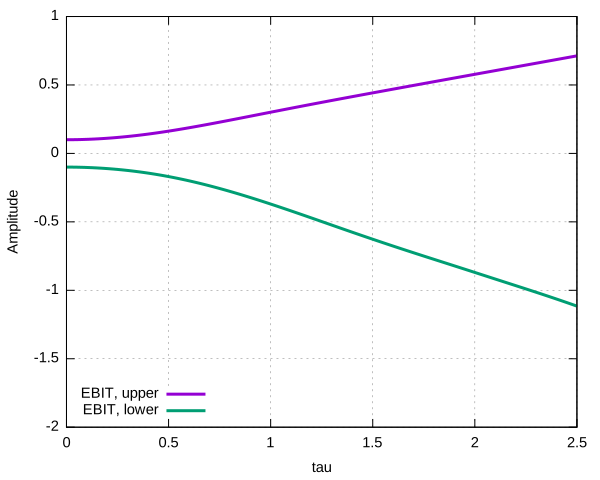
reset
set size ratio -1
plot [0.:1.][0.5:3.] 'rt_intf_ebit_1.00.dat' w l t "tau = 1.00"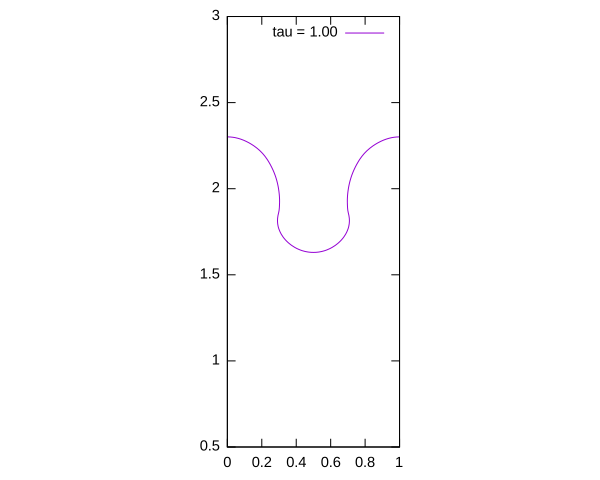
plot [0.:1.][0.5:3.] 'rt_intf_ebit_1.50.dat' w l t "tau = 1.50"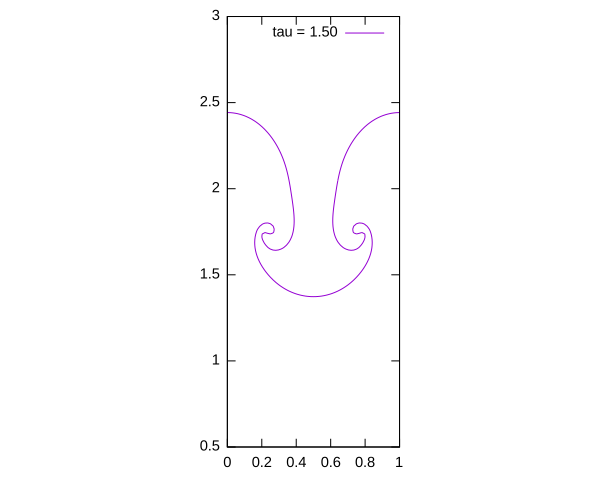
plot [0.:1.][0.5:3.] 'rt_intf_ebit_1.75.dat' w l t "tau = 1.75"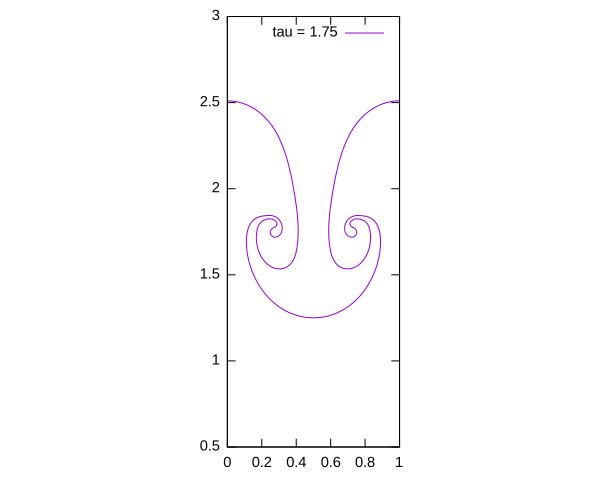
plot [0.:1.][0.5:3.] 'rt_intf_ebit_2.00.dat' w l t "tau = 2.00"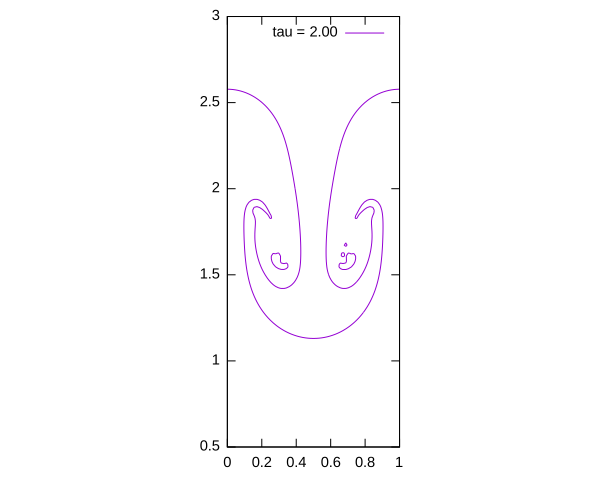
plot [0.:1.][0.5:3.] 'rt_intf_ebit_2.25.dat' w l t "tau = 2.25"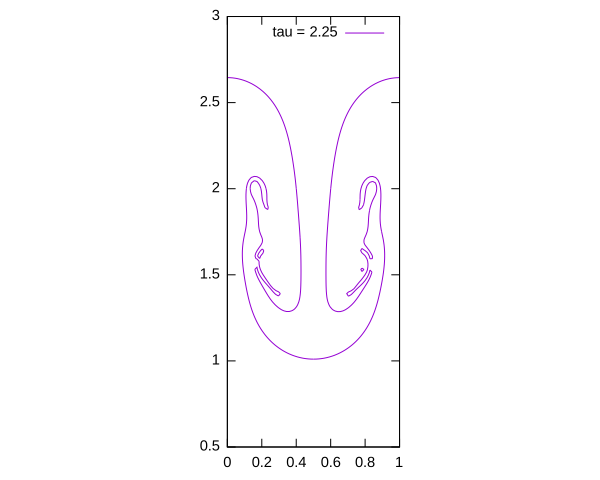
plot [0.:1.][0.5:3.] 'rt_intf_ebit_2.50.dat' w l t "tau = 2.50"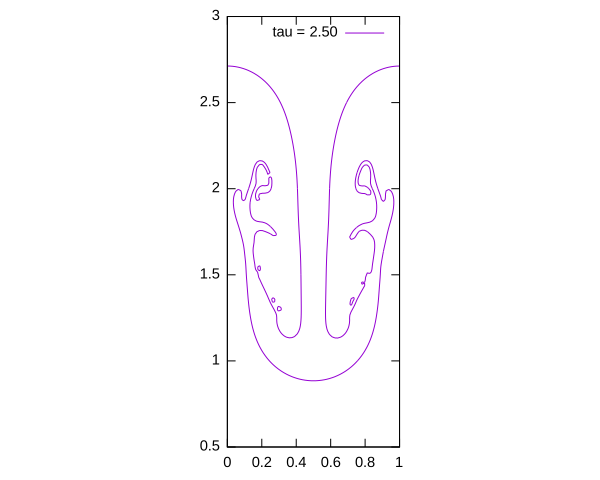
See also
References
| [tryggvason1988] |
Grétar Tryggvason. Numerical simulations of the rayleigh-taylor instability. Journal of Computational Physics, 75:253–282, 1988. |