sandbox/jieyun/test/capillary_ebit.c
Capillary wave
This is the classical test case first proposed in Popinet & Zaleski, 1999.
We use a constant-resolution grid, the Navier–Stokes solver with VOF interface tracking and surface tension.
#include "prosperetti.h"

#include "navier-stokes/centered.h"
#include "two-phase-ebit.h"
#include "tension.h"
We make sure that the boundary conditions for the face-centered velocity field are consistent with the centered velocity field (this affects the advection term).
uf.n[left]   = 0.;
uf.n[right]  = 0.;
uf.n[top]    = 0.;
uf.n[bottom] = 0.;

int level = 7;
double se = 0;
int ne = 0;
const double PLANE = (2. + 1.e-4) [1];
const double DY = 0.01 [1];
FILE *fp, *fp_err;

int main() {
  rho1 = 1. [-3, 0, 1];
  rho2 = 1.;
  mu1 = 0.0182571749236;
  mu2 = 0.0182571749236;

  f.sigma = 1.;
  DT = 2.e-1 [0, 1];

  TOLERANCE = 1e-6 [*];
  size (4 [1]);

  fp_err = fopen("error.dat", "w");

  for (level = 5; level <= 7; level++) {
    init_grid (1 << level);
    run();
  }

  fflush(fp_err);
  fclose(fp_err);
}


event init (i = 0) {
  vertex scalar phi[];
  foreach_vertex()
    phi[] = -(PLANE - y - DY*cos(2. [-1]*pi*x));

  init_markers (phi);

  se = 0.;
  ne = 0.;
  char name[80];
  sprintf (name, "wave_ebit_%d.dat", N);
  fp = fopen (name, "w");
}
By default tracers are defined at t-\Delta t/2. We use the first keyword to move VOF advection before the amplitude output i.e. at t+\Delta/2. This improves the results.
To get an accurate amplitude, we reconstruct interface position (using height functions) and take the corresponding maximum.
  double maxi = 0.;
  foreach_face(y, reduction(max:maxi)) {
    double yc = fabs(y - PLANE);
    if (with_marker.y[] && yc > maxi)
      maxi = yc;
  }

  foreach_face(x, reduction(max:maxi)) {
    double xc = fabs(y - (0.5 - s.x[])*Delta - PLANE);
    if (with_marker.x[] && xc > maxi)
      maxi = xc;
  }

  fprintf (fp, "%g %g %g\n", t*11.1366559937, maxi, prosperetti[ne][1]);
  fflush (fp);

  se += sq(maxi - prosperetti[ne][1]);
  ne++;

  if (level == 7) {
    fprintf (stderr, "%g %g\n", t*11.1366559937, maxi);
    fflush (stderr);
  }
}

event error (t = end) {
  fprintf (fp_err, "%g %g\n", N/L0, sqrt(se/ne)/0.01);
  fclose (fp);
}
Results
set xlabel 'tau'
set ylabel 'Relative amplitude'
plot '../prosperetti.h' u 2:4 w l t "Prosperetti", \
     'wave_ebit_128.dat' every 10 w p t "EBIT"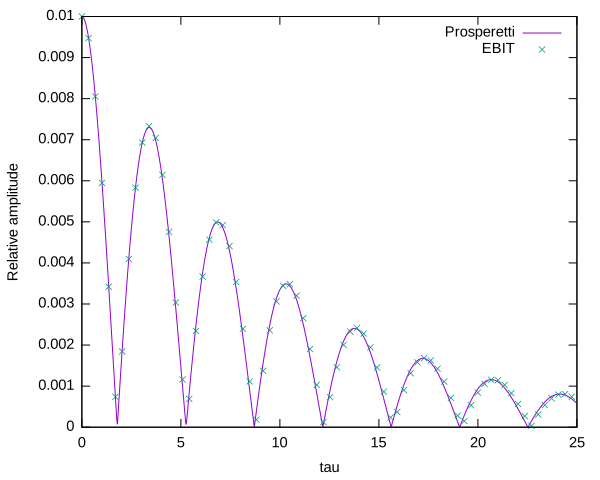
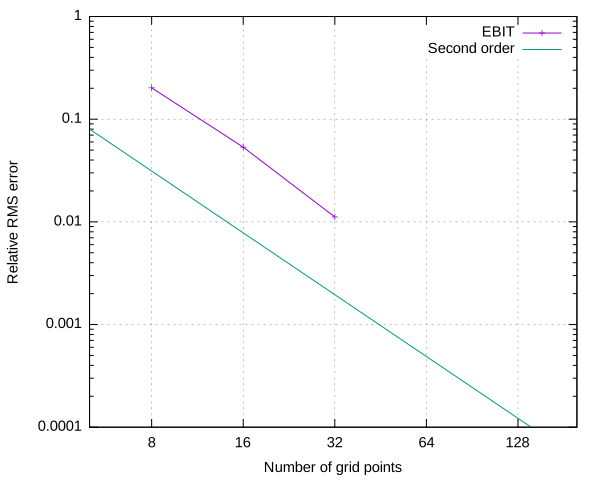
set xlabel 'Number of grid points'
set ylabel 'Relative RMS error'
set logscale y
set logscale x 2
set grid
plot [5:200][1e-4:1]\
     'error.dat' t "EBIT" w lp, 2./x**2 t "Second order"